
The City of Boca Raton and the US Department of Transportation recently completed an agreement regarding the $300,000 Vision Zero Action Plan grant award. The agreement specifies the terms and conditions for the city’s receiving the funds from the grant.
We will provide updated details on Boca Raton’s Vision Zero project in a follow-up article. This article focuses on Boca Raton’s roadway crash situation, i.e., the problem to be solved by Vision Zero.
Background
Vision Zero specifies that all roadway serious injuries and fatalities from Vehicle crashes must be eliminated. BocaFirst has been providing readers with information about Boca Raton’s situation and on Boca Raton’s plans for this initiative: BocaFirst Vision Zero Project – BocaFirst
The Problem
The raw data from the Florida Traffic Safety Dashboard says that vehicle crashes result in more serious injuries and fatalities in Boca Raton than pedestrian and bike collisions with vehicles. But as shown in the table below, the probability of a serious injury and fatality from a pedestrian or bike collision with a vehicle is much higher when a crash does occur. Fatality chances are 10 times higher and serious injury are 5 times higher. That is, pedestrians and cyclists are the more vulnerable road users and are at greater risk. So, while there are more vehicle-on-vehicle crashes, it is the Vehicle vs Pedestrian/Cyclist crashes that result in higher injury and fatalities.
| All Crashes | Ped/Bike Crashes | ||||||
| Year | Quantity | Serious | Fatalities | Quantity | Serious | Fatalities | |
| 2013 | 5675 | 120 | 12 | 154 | 16 | 2 | |
| 2014 | 6536 | 105 | 10 | 138 | 8 | 4 | |
| 2015 | 6645 | 80 | 15 | 112 | 11 | 1 | |
| 2016 | 5857 | 112 | 18 | 100 | 9 | 4 | |
| 2017 | 5297 | 79 | 10 | 80 | 7 | 2 | |
| 2018 | 4796 | 61 | 13 | 77 | 9 | 1 | |
| 2019 | 5896 | 87 | 7 | 102 | 13 | 1 | |
| 2020 | 3759 | 50 | 13 | 75 | 8 | 2 | |
| 2021 | 4683 | 57 | 15 | 84 | 8 | 2 | |
| 2022 | 5348 | 98 | 13 | 119 | 14 | 5 | |
| TOTAL | 54492 | 849 | 126 | 1041 | 103 | 24 | |
| 2% | 0.2% | 10% | 2% |
To better visualize trends in the data in the above table we created four charts with trend lines. There is ten years of data in various categories in the above table. In the charts below, we look at specific categories of interest.
Since the COVID-19 pandemic created a transportation disruption we added a three-year trend line to the graphs to show crash behavior during the three pandemic years – 2020-2022. That is, the three pandemic years cause a skew in the ten-year trend. This skew creates an error factor in the trend. So, we show it as a separate 3-year trend in addition to the 10-year trend.
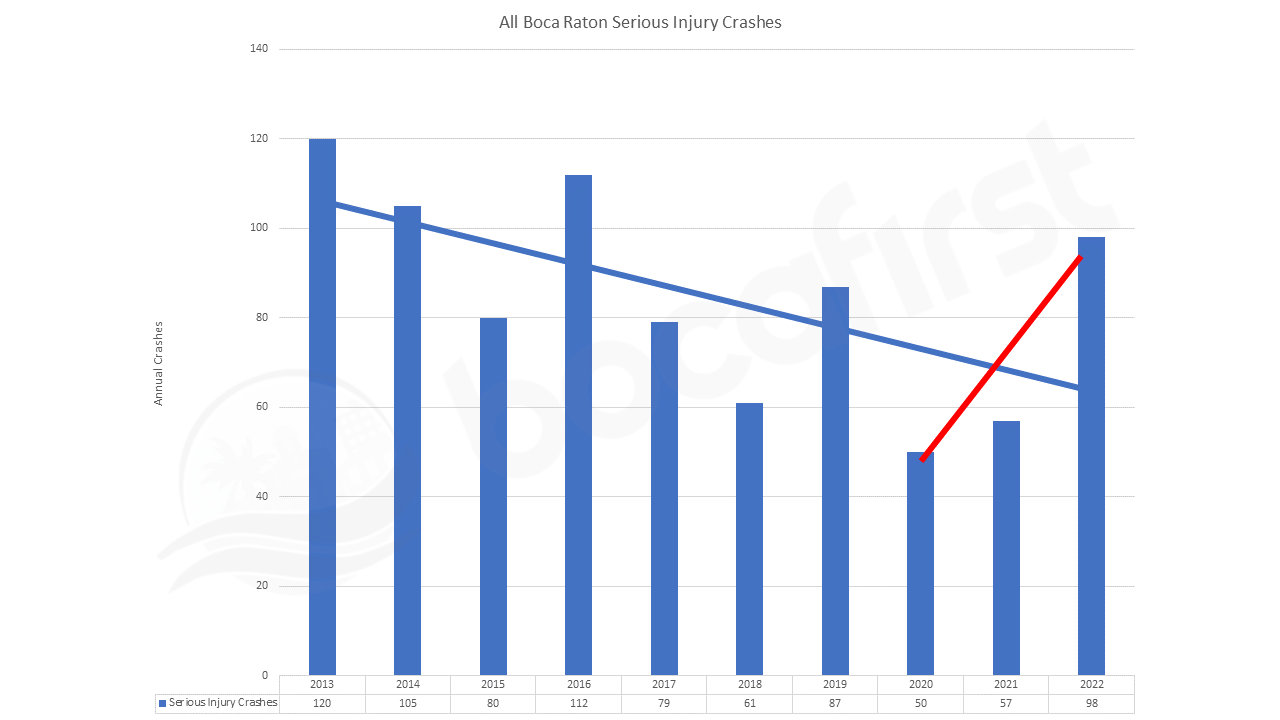
All Crashes With SeriousInjuries
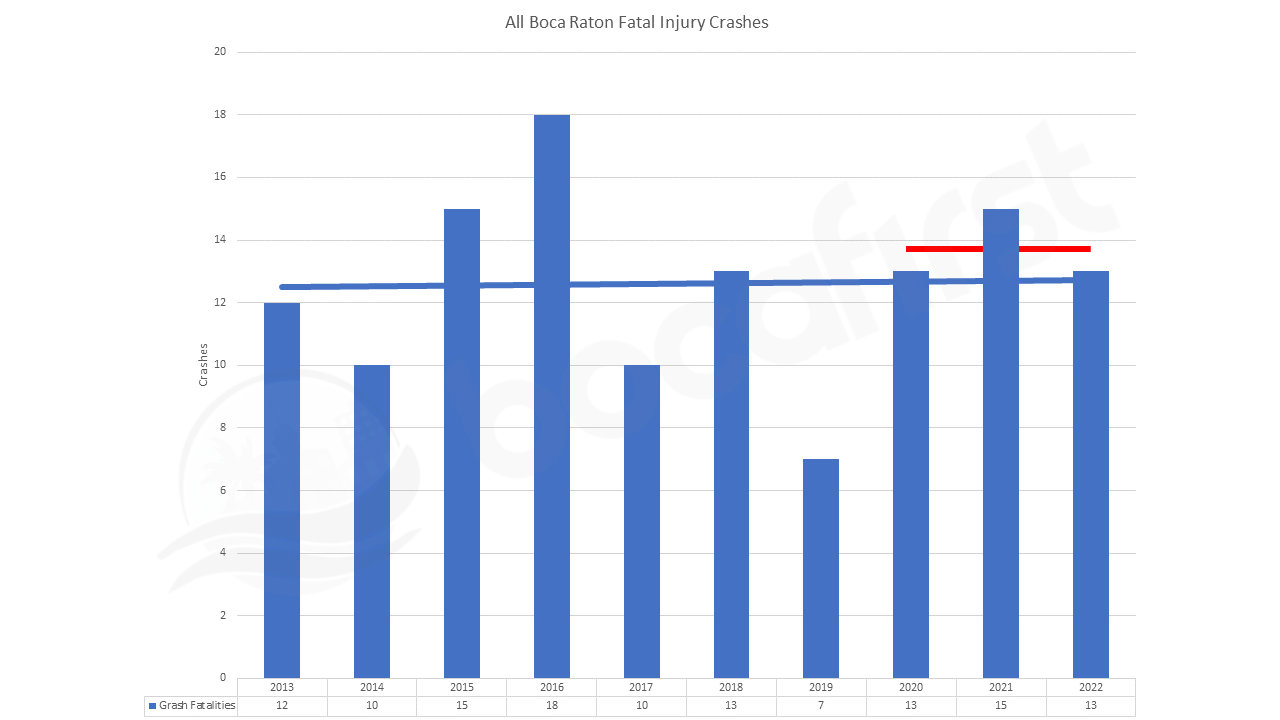
All Crashes With Fatalities
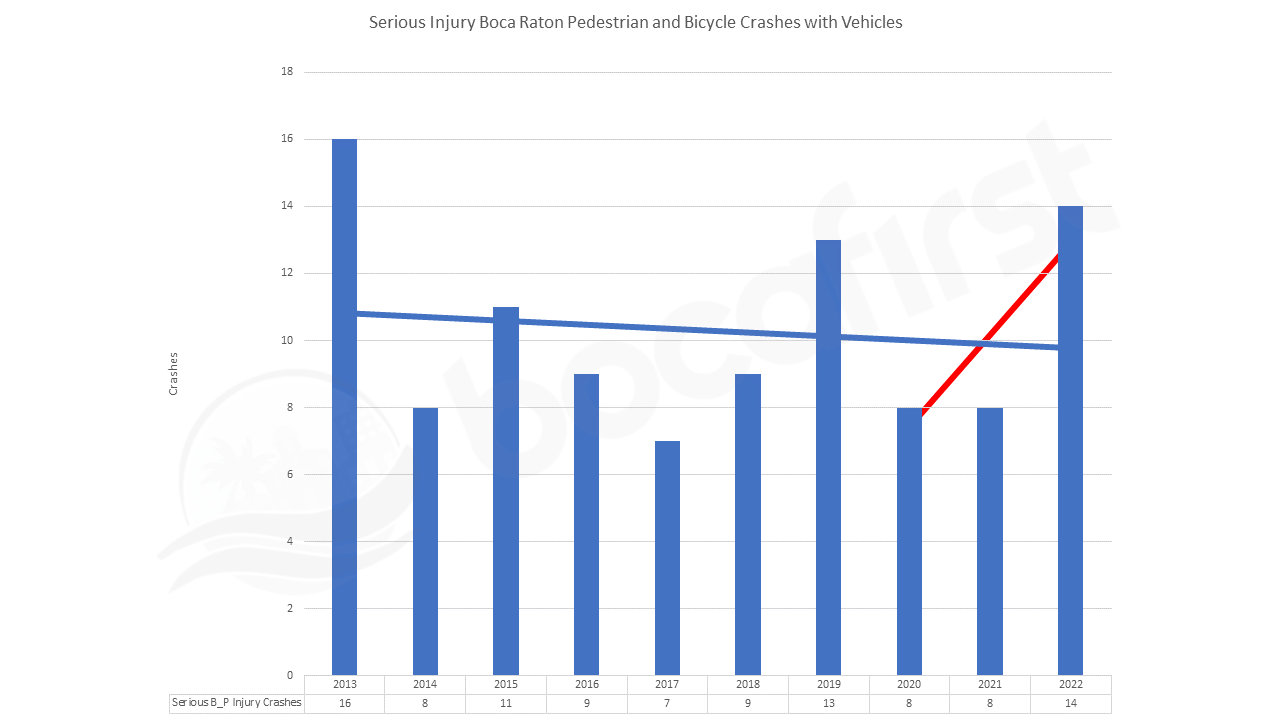
Pedestrian and Bicycle Crashes With Serious Injuries
Pedestrian and Bicycle Crashes With Fatalities
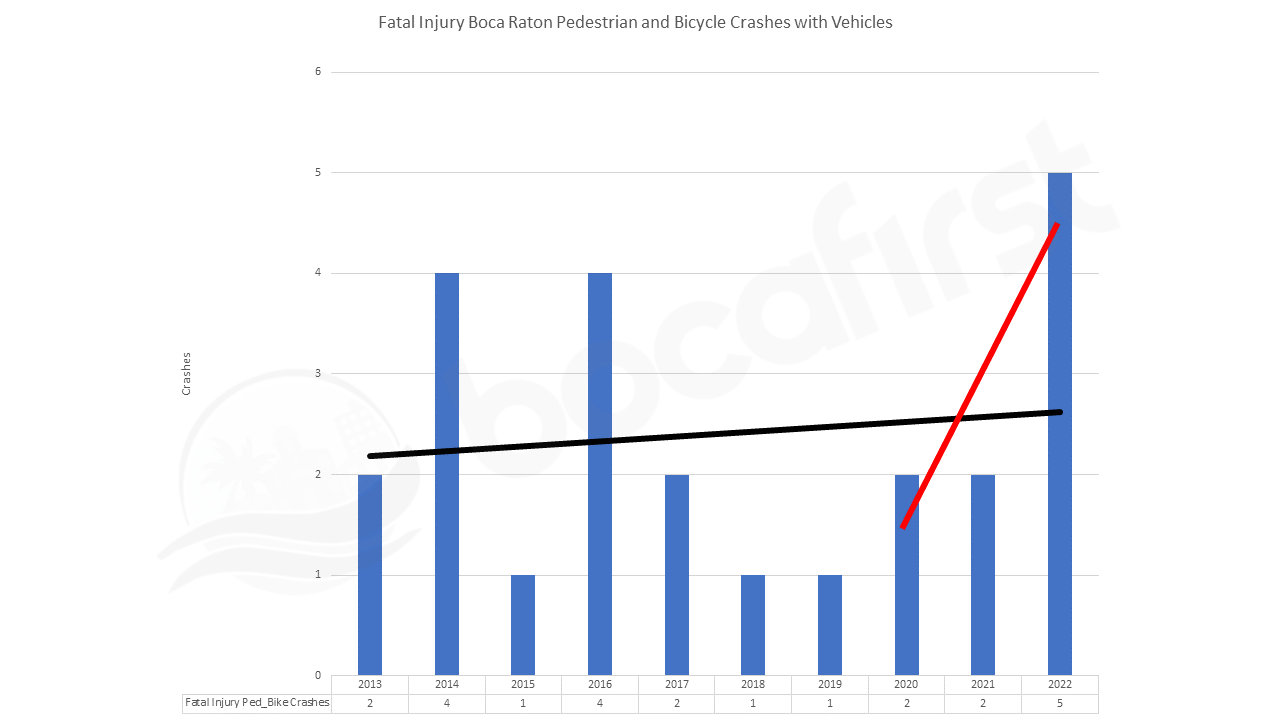
With the exception of the second chart, All Crashes With Fatalities, the other three charts show a sharp increase in serious injuries and fatalities through the pandemic years. The data shows that both vehicle and non-vehicle road user crash injuries and fatalities are on the rise in Boca Raton. In order for Vision Zero efforts to eliminate them, the Vision Zero plan must address both.
Summary
We presented ten years of Boca Raton crash information to help provide guidance to the city’s Vision Zero planners. Since the COVID-19 pandemic caused a major transportation disruption we also highlighted the crash trends during the pandemic years.