
I had a statistics professor who opened the semester saying “There are two types of people in the world. Those who are good at math and those who aren’t.” … wait for it.
Information loving Floridians are fortunate. The state of Florida has led the way in data transparency during COVID-19. This along with the value of community data was highlighted by Dr Birx on Meet the Press back in April.
Since the beginning of April, fellow BocaFirst volunteer and data geek Jim Wood and I have been culling, analyzing and visualizing pandemic data from the Florida Department of Health’s and Florida Emergency Management’s websites. We wanted to go beyond the simple “snapshot” COVID Trackers that give you totals at the moment. We wanted hard to find data on Boca and Palm Beach County so we could turn the numbers into easily consumed graphics to help folks protect themselves and govern our community. We wanted to create a spirit of being in this together. That begat the BocaFirst COVID Tracker project.
Since then, the conversation about COVID-19 has evolved. So we evolved the tracker with graphics on the criteria for reopening as well as national/local rankings. Our results are presented without commentary and to the best of our ability, without bias because we need to be in this together.

Some people are brutal. They’re not in this together.
In the midst of the partisan conversation around us, there’s no shortage of people and organizations using/misusing data. But beyond the dichotomy of those good at math and those who are not, a third category is visible: “Those who are in this together.”
You can find them in the social media conversations ignoring those who are bashing others. The “in this together” folks are pursuing solutions. You can also find them picking up neighborhood litter, delivering groceries to the elderly, making masks for orphans, feeding the out of work hungry and generally using their time, resources and knowledge to help neighbors, city officials and county officials find safe and rational solutions to both our health and economic well-being because, well, like it or not, we ARE in this together.
Like politics, data is messy
Anyone paying attention to pandemic data in Palm Beach county witnessed a data blunder by Yahoo. The pattern is obvious when you know what to look for: an unnamed source and an unpublished memo leaked to the press then used to create a headline. It seems someone turned a 17 into 71 or some such blunder. The Palm Beach Post debunked the Yahoo piece along with some local “Good at Math” types. Apparently, nobody at Yahoo checked the data. With a degree in mathematics, BocaFirst volunteer Jim Wood has a nose for those things and, pardon the pun, keeps our tracker on track.
The volume of data is both a blessing and a curse. There are reports focused on the state that include summary county/city data but there are also county level reports with the same data; only different. Sometimes the two don’t align and you have to dig further. An example of this is a recent article in the Sun Sentinel with a graphic of the daily case counts in Palm Beach County. It didn’t mesh with the daily case count data we collected from the FDOH County report for PBC.
This is the graphic from the Sun Sentinel for Daily Cases between April 19 and May 14.

This is the 14-day history of daily cases in Palm Beach County page of the FDOH County report for May 1-15.

Even after adding non-residents to the FDOH County Report data, the two don’t match.

After some experimental calculations, it was obvious the Sun Sentinel did not base its article on the PBC data in the State’s County report. It took some digging to figure out. Those familiar with the case count data know you have to pay attention to two issues:
- Some data from the FDOH includes non-residents while other data separates them.
- Some counts of cases include duplicates and you have to know the difference
Going to the state report that includes summary data about Florida counties, I found a summary case total.

That total included non-residents but offered no explanation about how it handled multiple tests per day for the same person and other scenarios where one person causes multiple positive test results. Using our collection of state reports and generating the difference between each day’s totals, I was able to recreate the Sun Sentinel graphic of daily cases.

Is it right or wrong?
When you parachute into a complex data situation thinking it’s simple, mistakes can be made. Because we looked at the data daily, we knew that the FDOH county reports have counts that filter duplicates so we check for that. The description of the counts we use says:
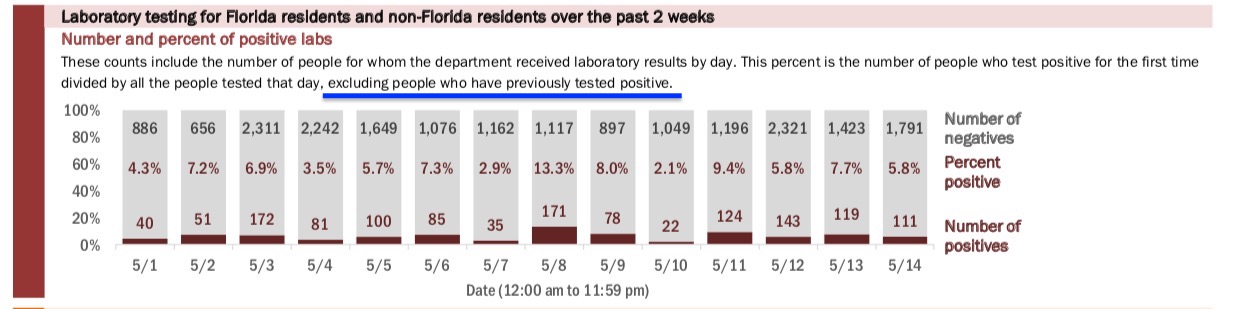
“These counts include the number of people for whom the department received laboratory results by day. This percent is the number of people who test positive for the first time divided by all the people tested that day, excluding people who have previously tested positive.
FDOH County Report for Palm Beach County May 15 2020
Here is an excerpt of the May 15 FDOH County report and the data we use:
The FDOH County Report filters duplicates. The FDOH state level report summary totals used by the Sun Sentinel don’t square with the data in the County report and the description shown in the FDOH State Report above isn’t specific. Which is right?
Trends, Trends, Trends
The benefit of collecting data over time is being able to show trends in cumulative data. There’s a phenomenon of “Data Dumps” where data that was created over a couple days gets reported all at once. It’s often on Mondays with weekend data collected but not reported till Monday. Sometimes you can see this clearly in 7-day humps in the graphics. The BocaFirst Tracker has several of them.

Daily data such as positive test results can fluctuate wildly from day to day so it’s not obvious how things are trending. Data dumps make it worse. For that data, the BocaFirst Tracker provides the raw data plus a 7-day moving average to smooth out the data.

Lastly, the federal criteria for opening is based on 14-day trends. The criteria say things must be going up, down or be flat. For that data, the BocaFirst Tracker uses a straight linear trend line and calculates its trajectory and magnitude positive or negative.

After more than a month of wrestling with the data, today’s BocaFirst tracker has four dashboards of 4-up graphics on Boca Raton and Palm Beach County. Those dashboards are updated Monday, Wednesday and Friday.

Sunday is our “Big Picture” edition where we update weekly dashboards on hospital utilization and rankings of Palm Beach County with others. Some of our graphics are the results of reader questions and suggestions so let us know what information valuable to you. We’re in this together.
